Mapping Transaction Velocity Patterns to Supplier Restocking Timelines in Omnichannel Retail Networks
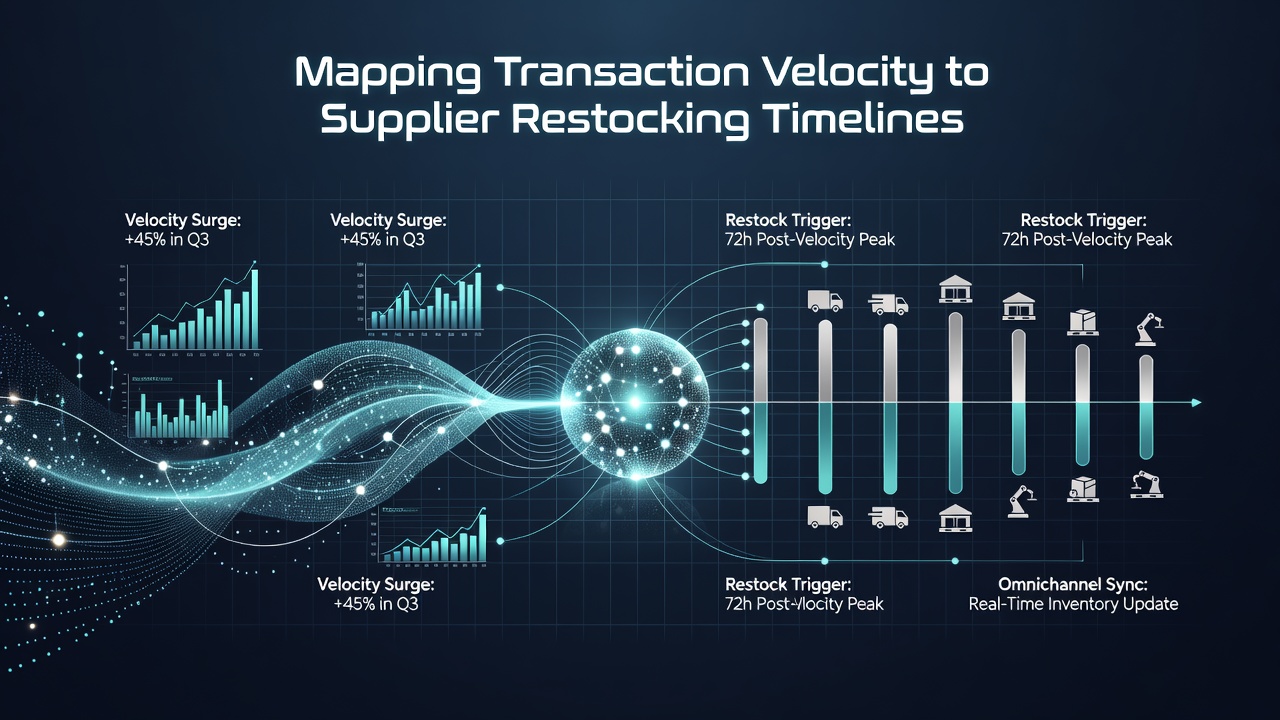
Retail networks that span physical stores and digital platforms rely on precise alignment between how quickly products sell and when suppliers receive restocking orders. Transaction velocity refers to the measured rate at which individual items move through checkout systems, while supplier restocking timelines track the lead times required to replenish shelves or warehouses. Observers note that mapping these two elements allows retailers to adjust orders before gaps appear in either channel.
Understanding Velocity Data Across Channels
Point-of-sale terminals in brick-and-mortar locations capture unit sales every minute, and e-commerce platforms log similar events through order management systems. Researchers have found that combining these streams into unified datasets reveals patterns invisible when each channel operates separately. For example, a product showing steady in-store velocity but sudden online spikes can trigger earlier supplier notifications than either channel would suggest on its own.
Systems aggregate velocity figures into hourly or daily buckets, then compare them against historical lead times supplied by vendors. This comparison produces recommended restocking windows that account for both current demand speed and typical shipping durations. Data from multi-channel retailers indicates that such alignment reduces instances where high-velocity items sit out of stock for more than two days.
Integration of Real-Time Feeds and Predictive Models
Many networks feed velocity metrics directly into inventory planning software that already holds supplier contract details. These platforms apply statistical models to forecast when cumulative sales will reach the reorder threshold, factoring in both online order fulfillment centers and physical store locations. According to industry reports from the National Retail Federation, retailers using integrated velocity-to-restock mapping achieved average inventory turnover improvements of 12 percent between 2024 and 2025.
By July 2026, several large chains had expanded these models to include weather and local event data that historically influence transaction rates in specific regions. The expanded inputs allow restocking timelines to shift forward or backward by a day or two without manual intervention, keeping shelves aligned with projected demand surges.
Case Examples from Distributed Retail Operations
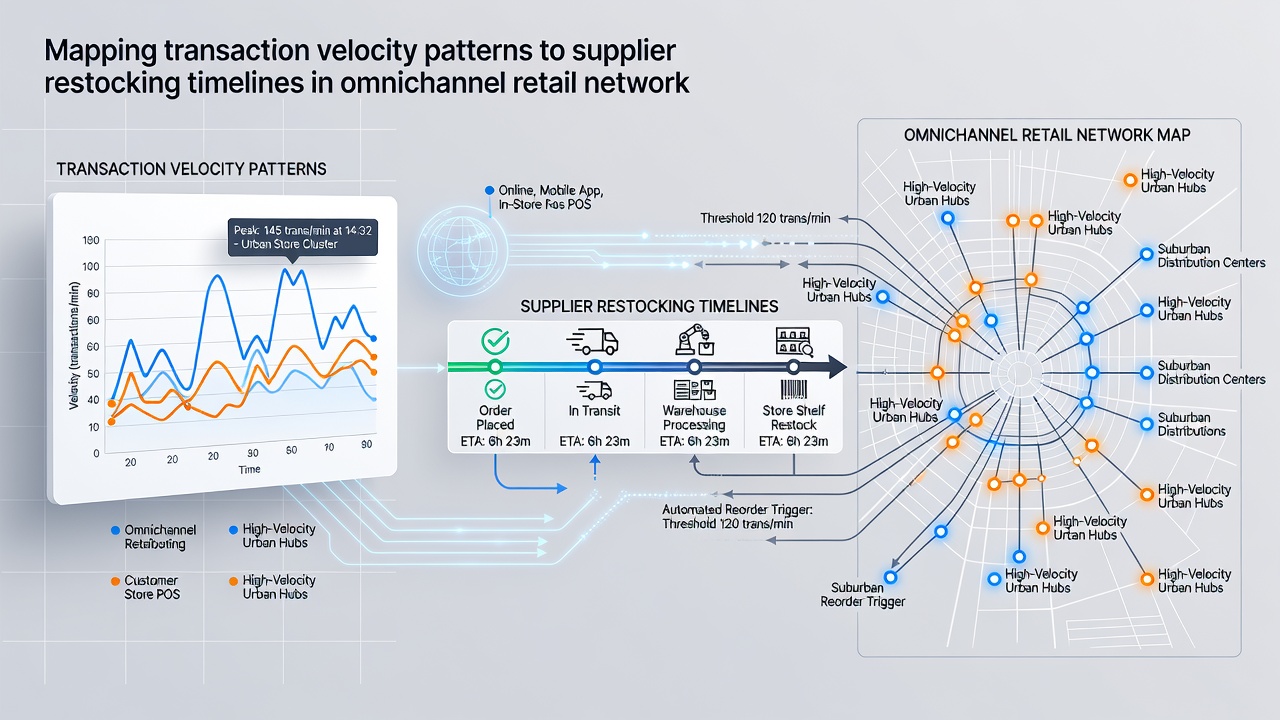
One mid-sized apparel group operating 180 stores and a high-volume website discovered that certain seasonal jackets moved three times faster online during the first week of each month. Mapping this pattern against supplier production schedules prompted the company to place advance orders two weeks earlier than its previous calendar-based approach. Stockouts in both channels dropped measurably after the change.
Another network handling electronics across urban stores and regional distribution centers tracked velocity spikes that coincided with promotional campaigns. The resulting restocking protocol now triggers partial shipments to stores nearest the highest-velocity zones while routing the balance to fulfillment warehouses, shortening average replenishment cycles by 18 percent.
Technical Requirements adn Data Standards
Effective mapping depends on standardized data fields that identify each SKU across every sales channel and every supplier portal. Retailers implement application programming interfaces that push velocity summaries to supplier systems at fixed intervals, typically every four hours during peak periods. Studies from academic supply-chain research groups show that consistent formatting of these messages reduces order processing errors by up to 27 percent.
Security protocols protect the velocity data streams because they contain commercially sensitive sales information. Encryption at rest and in transit, combined with access controls limited to authorized planning teams, keeps the mapping process isolated from broader transaction networks.
Conclusion
Mapping transaction velocity patterns to supplier restocking timelines provides retail networks with a repeatable method for synchronizing sales speed and inventory arrivals. The approach draws on combined channel data, predictive modeling, and standardized supplier communications to maintain product availability without excess accumulation. Organizations that maintain these mappings continue to refine them as new sales channels and supplier capabilities emerge.